How to Measure and Improve User Experience on Your Blog
Source : How to Measure and Improve User Experience on Your Blog
Published On : April 15, 2021 at 06:59PM
By : Ankit Singla
User experience.
We all know it’s important by now.
The question is, are you doing enough to provide your audience with the best experience possible?
In this post, you’ll learn the fundamentals of measuring the user experience on your blog.
Let’s get to it.
Table Of Contents
- 1. User Experience Design: What Metrics to Track
- 1.1 Pages Per Session
- 1.2 Bounce Rate
- 1.3 Session Duration
- 1.4 Scroll Depth
- 1.5 Returning Visitors
- 1.6 Exit Rate
- 1.7 Conversion Rate
- 1.8 Sessions By Device
- 2. How to Measure Engagement Metrics
- 2.1 Tracking engagement metrics using Google Analytics
- 2.2 Using Google Tag Manager to track scroll depth
- 2.3 Measuring conversion rate
- 3. Conclusion
User Experience Design: What Metrics to Track?
To measure user experience, you need to know the metrics that matter.
Metrics are basically values used in measuring a website or application’s performance and quality. Engagement metrics, in particular, measure how users behave on your website, interact with your content, and respond to your offers.
If you don’t monitor engagement metrics, you’re essentially leaving the success of your blog to chance.
That said, here are the top engagement metrics you need to track in order to improve user experience:
1. Pages per session

Pageviews, sessions, monthly traffic – these are all important metrics that measure your blog’s popularity.
However, they don’t necessarily measure the experience your users are getting.
That’s why you need to focus on pages per session.
What does “pages per session” measure?
In simple terms, pages per session measures the number of posts and pages a user opens per visit.
Keep in mind that if a user checks out five pages in one visit, that still counts as one session. But with the pages per session metric, you can gauge how much they enjoyed reading and exploring your blog.
2. Bounce rate

Here’s another reason why you shouldn’t focus on pageviews alone when assessing user experience.
Imagine a visitor opening your page after seeing it in search results.
That’s one pageview, right?
Unfortunately, let’s say your content failed to capture their attention. This leads them to click the “back” button and return straight to Google.
That’s what counts as a “bounce.”
What does “bounce rate” measure?
Bounce rate measures the likelihood of single-page sessions on your website. If your blog’s bounce rate is high, it may be due to issues like slow loading speed or low-quality content.
In the end, your traffic means nothing if users don’t click on anything after reaching your blog. As such, you need to analyze pages with a high bounce rate to see how you can retain more visitors.
3. Average session duration

What sucks the most about having a high bounce rate?
It directly affects another important engagement metric: average session duration.
According to Google, single-page sessions (a bounce) have a session duration of zero. This can lead search engines to believe that you’re not offering anything worthwhile.
What does “average session duration” measure?
The average session duration metric tracks the time your readers spend on your website. If this number is high, it’s a pretty good indication that you produce insightful and engaging posts.
4. Scroll depth

Tracking the average session duration is useful in measuring how engaged your readers are.
However, that doesn’t translate to how much of your page they actually see.
Suppose a visitor spends 10 solid minutes checking out several pages on your website.
With that number, it’s safe to assume that they’re hooked on your blog, right?
But what if they’re actually frustrated – jumping from page to page and looking for the information they want? What if they simply left their computer and took a 10-minute break before going back and clicking something else?
Tracking the scroll depth metric will shed light on these uncertainties.
What does “scroll depth” measure?
The scroll depth metric can tell you how far users scroll on a page. Tracking is usually done by setting specific percentages or pixel count thresholds with the help of Google Tags.
For example, if a user has a scroll depth of 100 percent, that means they scrolled through the whole page. This is good news, especially if you have affiliate links, opt-in offers, or advertisements waiting at the bottom.
5. Returning visitors

If your blogging strategy is to frequently publish posts to keep your traffic alive, that’s not growth.
Rather, you’re in survival mode.
To truly grow your blog, you need passive traffic – the kind you get from search engines and returning visitors.
What does “returning visitors” measure?
As the name implies, “returning visitors” measures the percentage of traffic that comes from users who already visited you before. This, in turn, will help you instill, analyze, and foster loyalty among your readers.
6. Exit rate

Remember, people exit your website for a reason.
In some cases, they’re straight up not happy with what they saw on your page. At other times, they may have liked your content but didn’t know where else to click.
Whatever the reason, the deciding factor is ultimately the page itself.
By measuring the exit rate of your pages, you can identify problems that cause you to bleed traffic.
What does “exit rate” measure?
The exit rate metric measures how often visitors leave your website from a specific post or page. You can calculate the exit rate yourself by dividing a page’s total pageviews by the number of users who exited.
For instance, if a page’s exit rate is 90 percent, that means nine out of ten users leave from there.
Naturally, you’d want to inspect pages and posts with an exit rate that’s way above average. Look for fixable issues – be it missing images or intrusive pop-ups – and see if you can improve user retention.
7. Conversion rate

Conversions pertain to certain goals or actions that users take on a website. It can be a newsletter registration, file download, product purchase, or anything that generates value for website owners.
Personally, I think conversions are still the best indicator of engagement.
After all, users won’t convert if they don’t trust your brand. And in order to win their trust, you need to provide them with a memorable and compelling user experience.
If you want to maximize conversions, the first step is to start tracking your conversion rates.
What does “conversion rate” measure?
Conversion rate measures the likelihood of visitors to complete a specific goal on a website. It is calculated by dividing the number of pageviews by the total number of conversions.
The higher the conversion rate, the more efficient a page or post is at converting users. This, of course, will directly benefit your bottom line.
8. Sessions by device

Ever wondered what device your readers use to view your blog?
Sure, focusing on the engagement metrics above will help you evaluate and improve user experience. But if you’d like to go the extra mile, you should also think about your audience’s preferred browsing device.
This brings us to the sessions by device metric, which should be self-explanatory.
What does “sessions by device” measure?
Sessions by device tracks the percentages of users coming from desktops, tablets, and mobile devices. When it comes to user experience optimization, website owners normally prioritize the device that generates the most traffic.
How to Measure Engagement Metrics
Alright, you’re now familiar with the most important engagement metrics for user experience.
It’s time to talk about the tools that will help you measure them.
Let’s start with something simple.
Tracking engagement metrics using Google Analytics
With Google Analytics, you can actually track all the engagement metrics – from pages per session to sessions by device.
Don’t know how to use it?
Worry not – it’s really easy.
In fact, I’m confident you’ll be done within the next hour.

Google Analytics is an analytics platform that will give you an in-depth view of your website’s performance.
To set up your Google Analytics account, refer to the instructions found in this post.
Tracking bounce rate and average session duration
Once you’re done configuring your Google Analytics dashboard, you’re actually done with most of the work.
By then, you should already see two of the eight crucial engagement metrics right on the “Home” page.
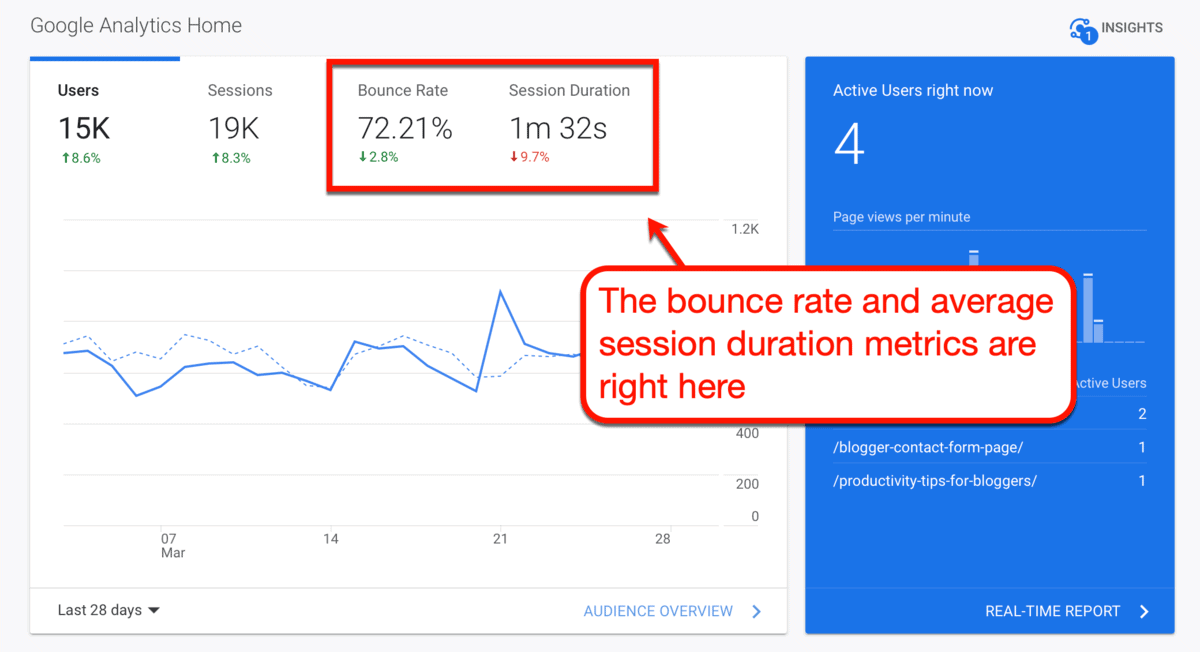
Easy-peasy.
Here are some tips that can help reduce bounce rate and increase your audience’s average session duration:
- Start with your website’s loading speed – If you’re using WordPress, use plugins to implement strategies like lossless image compression and caching. Click here for a detailed guide on how to speed up your blog.
- Pay attention to keyword intent – Make sure your content matches the intent and expectations of your audience. Learn more about search intent by reading this keyword research guide for beginners.
- Embed videos – Adding videos to your blog posts is a great way to extend your visitors’ average session duration. You don’t even have to create the videos yourself – just embed something relevant from YouTube and you’re golden.
- Try using exit-intent pop-ups – When done right, an exit-intent pop-up can single-handedly save your blog from a high bounce rate. Just be sure you have an irresistible offer for visitors who want to leave your website.
Tracking sessions by device
From the Google Analytics home page, scroll down a bit and you should also see the sessions by device numbers.

By observing these numbers, you can determine which version of your website deserves your utmost attention.
For example, if most of your visitors are coming from mobile, it might be worthwhile to reevaluate your blog’s mobile friendliness.
Google’s very own Mobile-Friendly Test should come in handy for this purpose.

Three engagement metrics down – five more to go.
Tracking pages per session and returning visitors
Let’s use Google Analytics to get to know your audience a little better.
All you have to do is go to the ‘Audience’ sub-menu and click ‘Overview.’
Both the pages per session and returning visitors metrics should be right there waiting for you.

Here are a few ideas that can help improve both engagement metrics:
- Use internal links well – Internal links can help optimize your blog for search engines and maximize the value users get from your content. Focus on building a solid internal link structure to make sure you’re doing it right.
- Build sidebar navigation links – You can lead readers to pillar content by adding navigation links to your sidebar. I implement the same strategy myself by adding the “Useful Blogging Guides” sidebar to my blog post template.
- Make quality content your top priority – To generate returning visitors, you need to consistently and regularly publish high-quality blog content. This takes commitment, experience, and the right strategies.
Tracking exit rates
Looking for your pages’ exit rates?
The easiest way to identify your problem pages is to head to ‘Behavior,’ select ‘Site Content,’ and click ‘Exit Pages.’
You should see the pages with the highest exit rates right there.

To reduce a page’s exit rate, you can utilize the strategies above on improving the pages per session metric.
It’s also imperative that you evaluate the page yourself and address specific issues that make readers leave. This can be anything, from poorly written content to a large image file that doesn’t load properly.
Now – you may be wondering, “where the heck can I find ‘scroll depth’ and ‘conversion rate’?”
This part can get a little tricky.
Using Google Tag Manager to track scroll depth
To track scroll depth on Google Analytics, you’ll need the help of another tool: Google Tag Manager.

Put simply, a tag is a piece of code from marketing, support, and analytics platforms for integration purposes.
To track scroll depth, you need to configure a custom tag for Google Analytics that uses the “Scroll Depth” trigger.
First, you need to create a new account specifically for your website. Just log into Google Tag Manager and click ‘Create Account’ to get started.

This will bring up the account setup page where you should input basic details, like your website’s name and URL.
Just remember to choose ‘Web’ under the “Target platform” section.
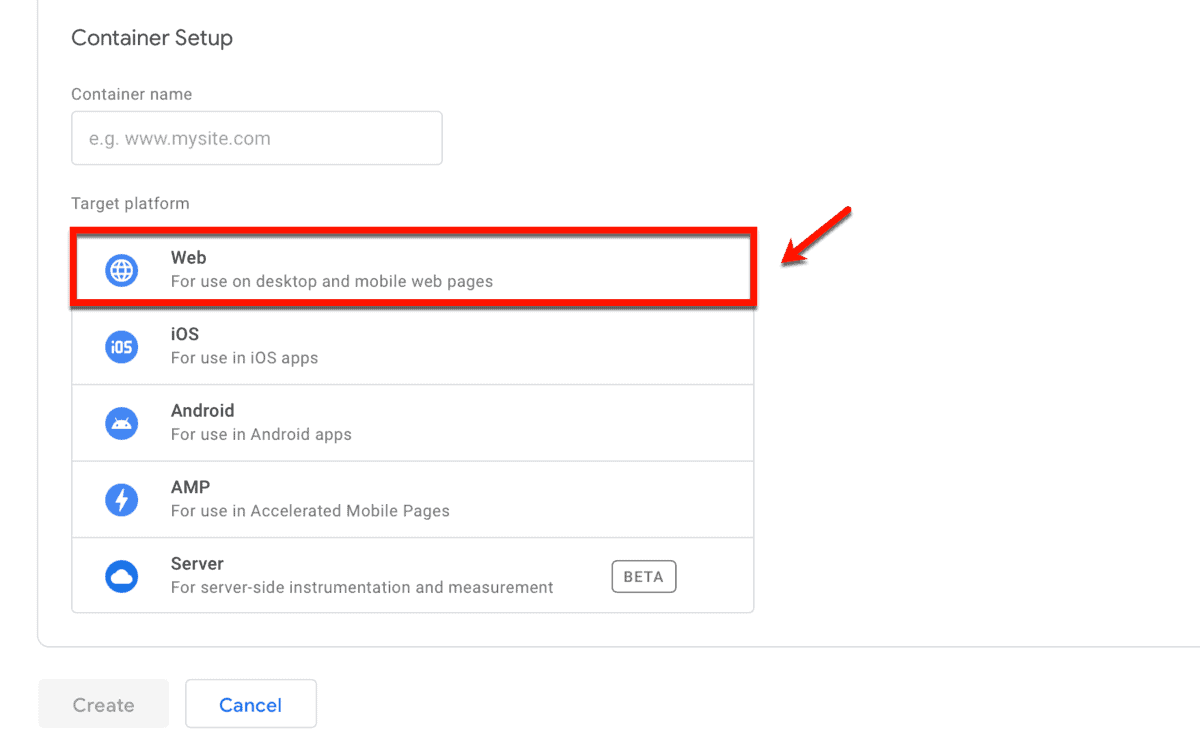
To finish the setup, you’ll have to copy two snippets of code into specific areas of your website.
It should be easy to do if you have a new blog with just a few pieces of content.

If you have an older bog with truckloads of pages, you can expedite the process with a WordPress plugin.
Google Tag Manager for WordPress, for example, automatically injects the necessary codes in the right places.
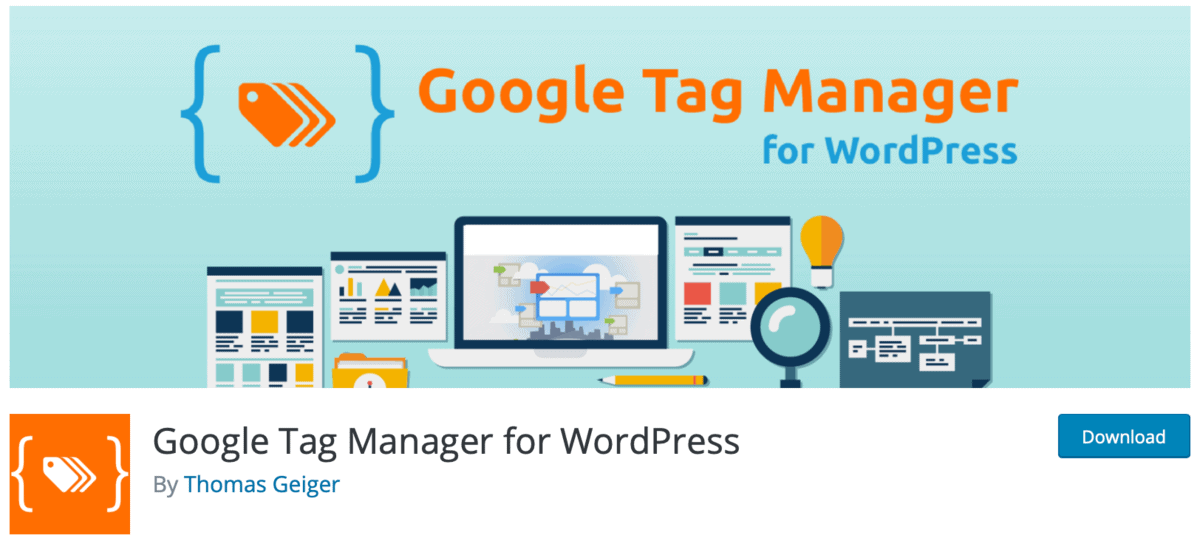
To use it, you just need to provide your Google Tag Manager ID on the plugin’s settings page.

With your Google Tag Manager account ready to go, you can now create a custom tag for tracking scroll depth.
First, you need to enable the necessary variables from the “Variables” page.
Just click ‘Variables’ from the main menu and click ‘Configure.’

Next, scroll down to the “Scrolling” variable category and enable the following variables:
- Scroll Depth Threshold
- Scroll Depth Units
- Scroll Direction
There’s no need to save your changes when enabling variables on Google Tag Manager. You just have to tick the checkboxes of the variables you need.
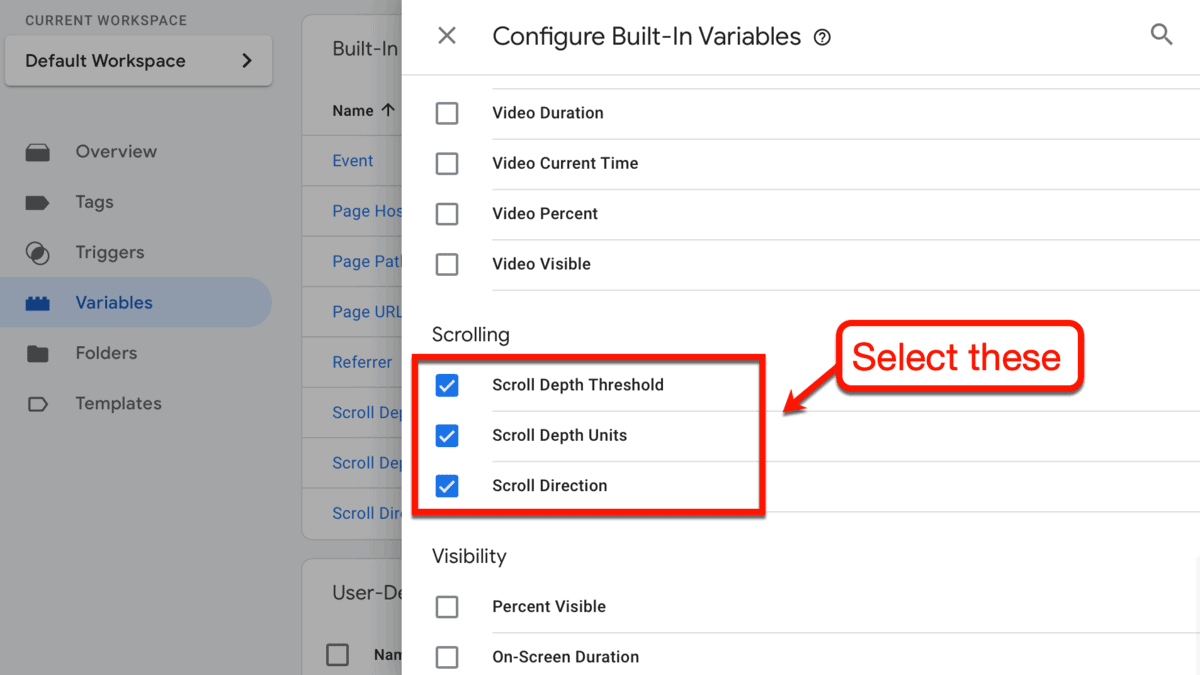
With these variables enabled, head over to the “Tags” page and click ‘New.’
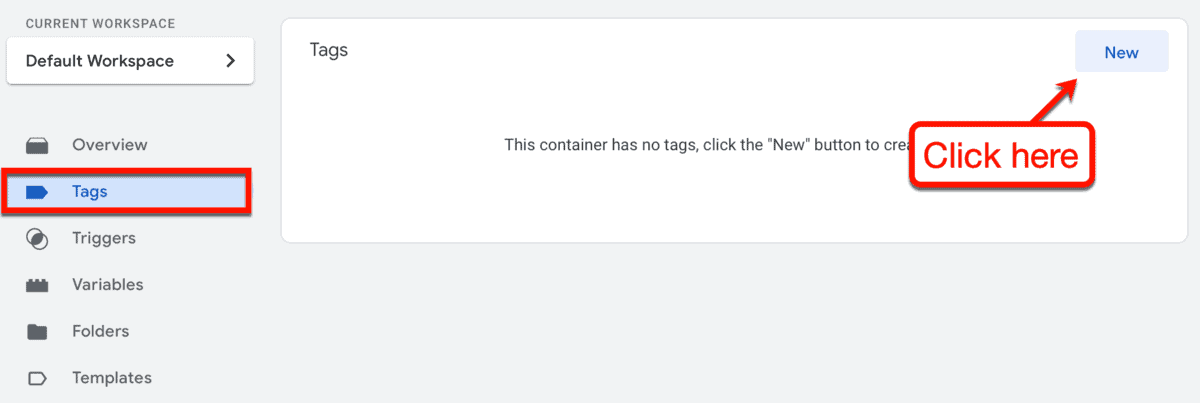
Go ahead and give your new tag a name. To help you find it later, use something simple and appropriate like “Scroll Depth.”

With a name in place, click ‘Tag Configuration’ and select ‘Google Analytics: Universal Analytics.’
It shouldn’t be hard to find, given it’s on top of the list.

Going back to the tag configuration page, set the “Track Type” to ‘Event.’ This will enable the additional options you need to track scroll depth, particularly the “Category” and “Action” fields.
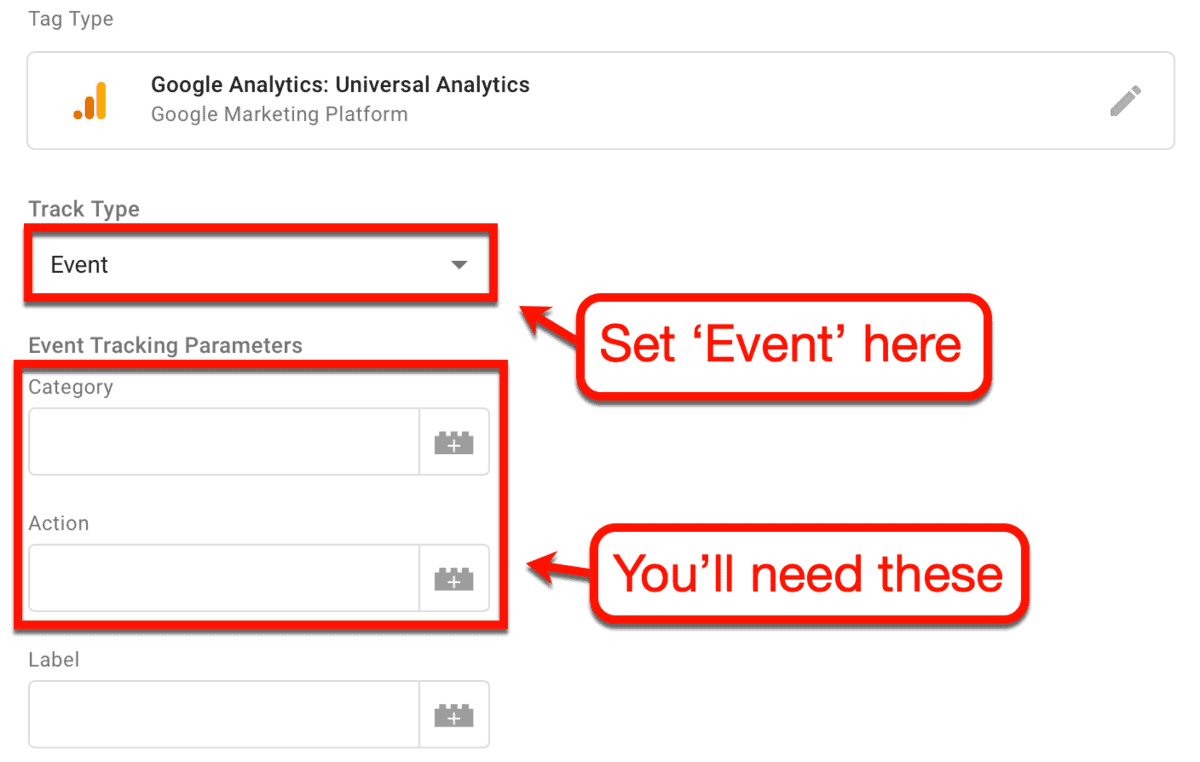
In the “Category” field, type any word that describes the user action you want to track. Again, it’s best to keep things simple and type in “Scroll” or something similar.
What you need to get right is the “Action” parameter. For that, click the ‘built-in variables’ button and select “Scroll Depth Threshold.”

Here’s a tip: add the percent symbol (%) right next to the “Scroll Depth Threshold.”
Remember, Google Tag Manager uses a scale of 1 to 100 to report scroll depth.
If the reader scrolls to the very bottom of your page, they’ll hit a scroll depth threshold of 100. Adding the percent symbol will then prompt Google Tag Manager to report “100%” instead of just “100.”
It’s not really a requirement, but it’s an easy way to make tracking extra convenient for you in the future.
You should also set “Non-Interaction Hit” to ‘True.’
Doing so will prevent the tag from affecting your website’s bounce rate.

Next up, you need to set the “Google Analytics Settings” to the variable with your Google Analytics Tracking ID.
If you don’t have one yet, simply select ‘New Variable’ and enter your Tracking ID in the proper field.

Lastly, you need to create triggers that will fire off the tag you just created.
To do this, click ‘Triggering’ back on the tag configuration page and click the ‘plus’ button.

This will pull up the “Trigger Configuration” page where you can set up and name your trigger.
From the list of trigger types, click ‘Trigger Configuration’ and select ‘Scroll Depth.’

After selecting the scroll depth trigger type, you can now enable Google Tag Manager to track vertical scrolls.
Simply check ‘Vertical Scroll Depths’ and enter the percentages you want to use.
Feel free to set the values you prefer. However, I recommend using the values “25,” “50,” “75,” and “100.”
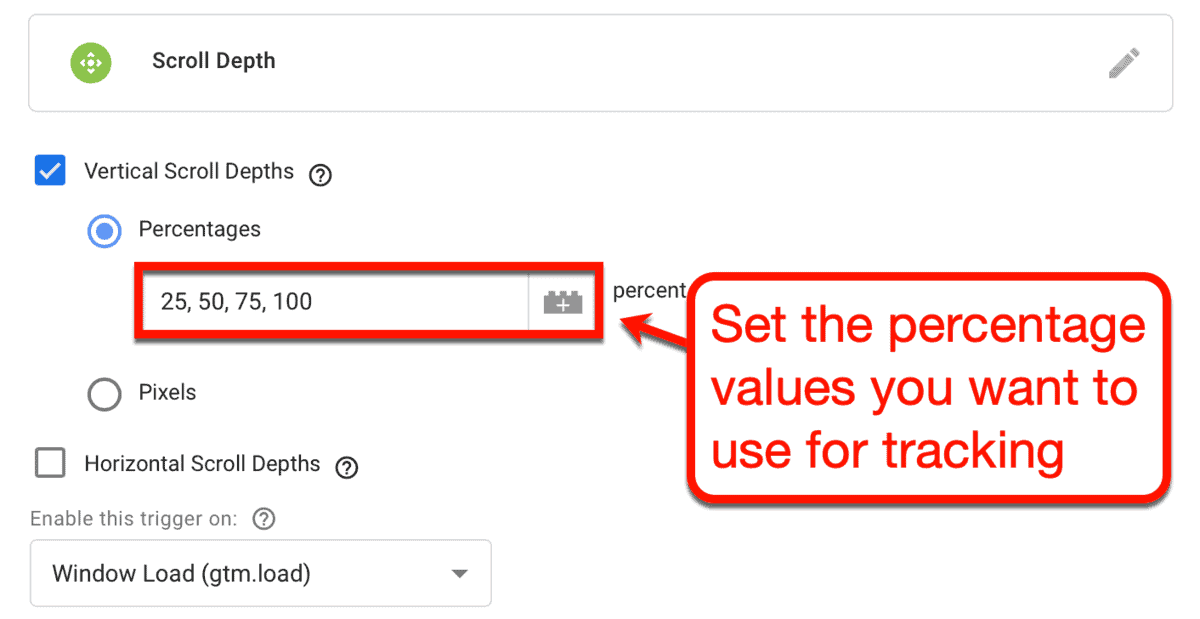
This essentially tells Google Tag Manager to track users who saw 25%, 50%, 75%, and 100% of your pages.
Take note that you can also use pixel counts to measure user scroll depth. But since posts and pages normally have different lengths, it’s better to use percentage values.
You can then leave the rest of the trigger configuration settings as is. Don’t forget to give your trigger an appropriate name before clicking ‘Save.’
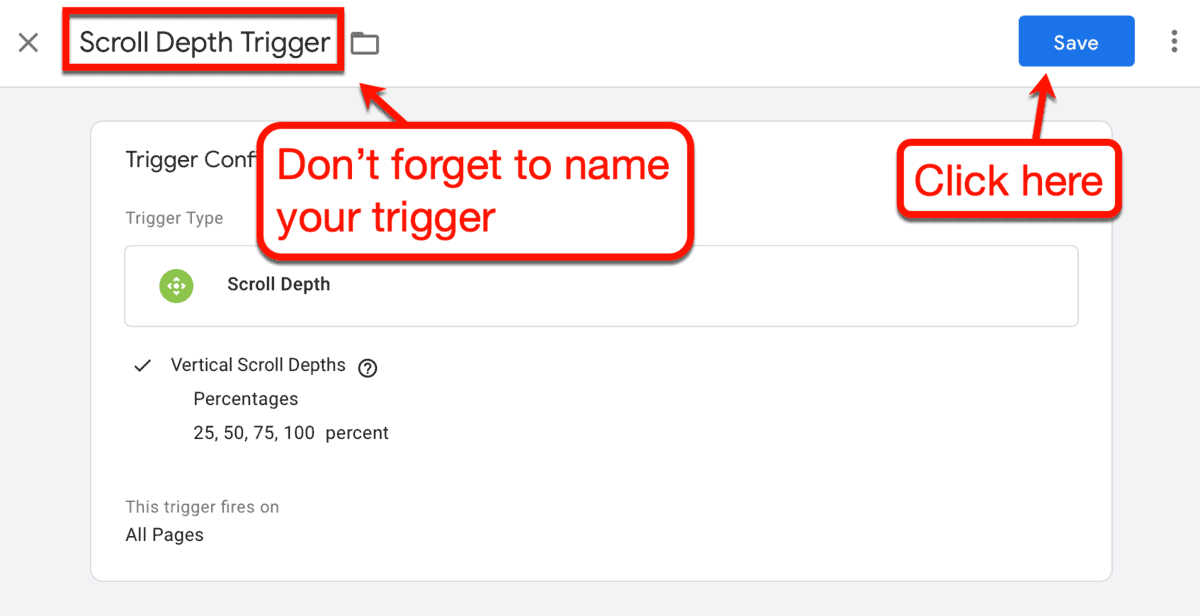
Congratulations – you’re now ready to monitor how far users scroll on your website via Google Analytics.
All that’s left to do is to publish your tag by selecting it on the “Tags” page and clicking ‘Submit.’
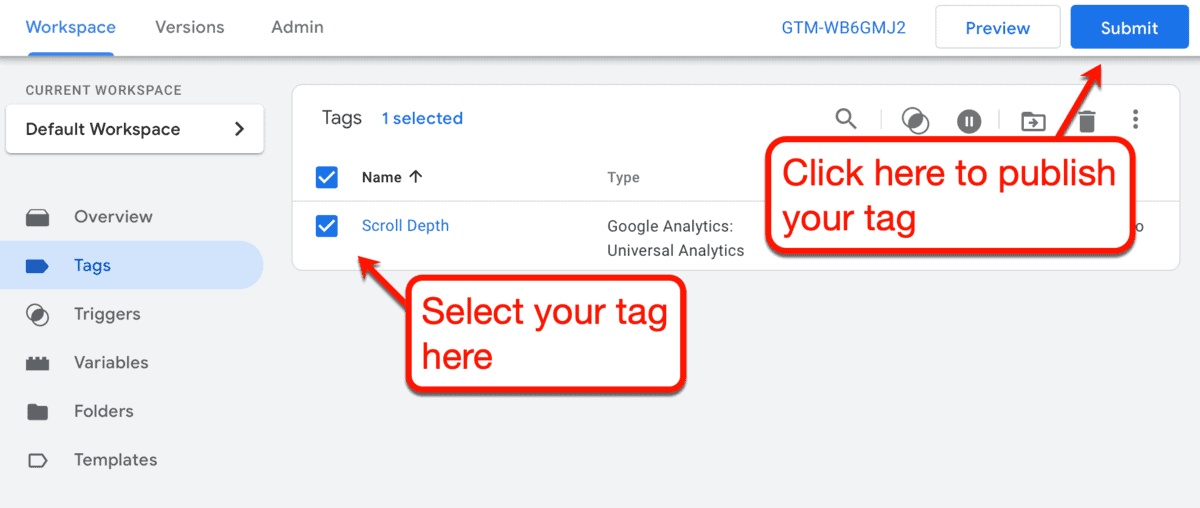
To finalize your tag’s version, just give it a name and description. Finally, click ‘Publish’ to submit and activate your tag.

You can use the Tag Assistant to check if your tag is working properly by clicking ‘Preview.’ Alternatively, you can directly test the tag by scrolling around your website and checking your Google Analytics account.
From the main dashboard, click ‘Behavior’ then expand the ‘Events’ sub-menu. Go to ‘Top Events’ and check if there are any scroll events recorded under “Event Category.”

Click on the scroll event category to inspect the individual instances or “Event Actions” wherein your tag is triggered.
The reported event actions will depend on the vertical scroll depths you defined earlier. For example, if you used the values “25,” “50,” “75,” and “100,” here’s what your report could look like:

Remember, the more engaged readers are, the further they’ll scroll down your content.
A high number of “100%” scroll events means you did a good job at creating content your audience enjoys. If most of the recorded scrolls stop at 50% or less, that means your readers aren’t engaged enough.
This might indicate a couple of issues, like:
- Your posts or pages are too long
- There aren’t enough elements that hook readers, like visuals or scannable headings
- You’re using too many links that don’t open in a new tab
Of course, it’s important to determine which pages are being abandoned and read thoroughly.
You can check which specific pages trigger scroll events by adding the “page” secondary dimension. For this, expand the ‘Secondary dimension’ drop-down menu and select ‘Page.’
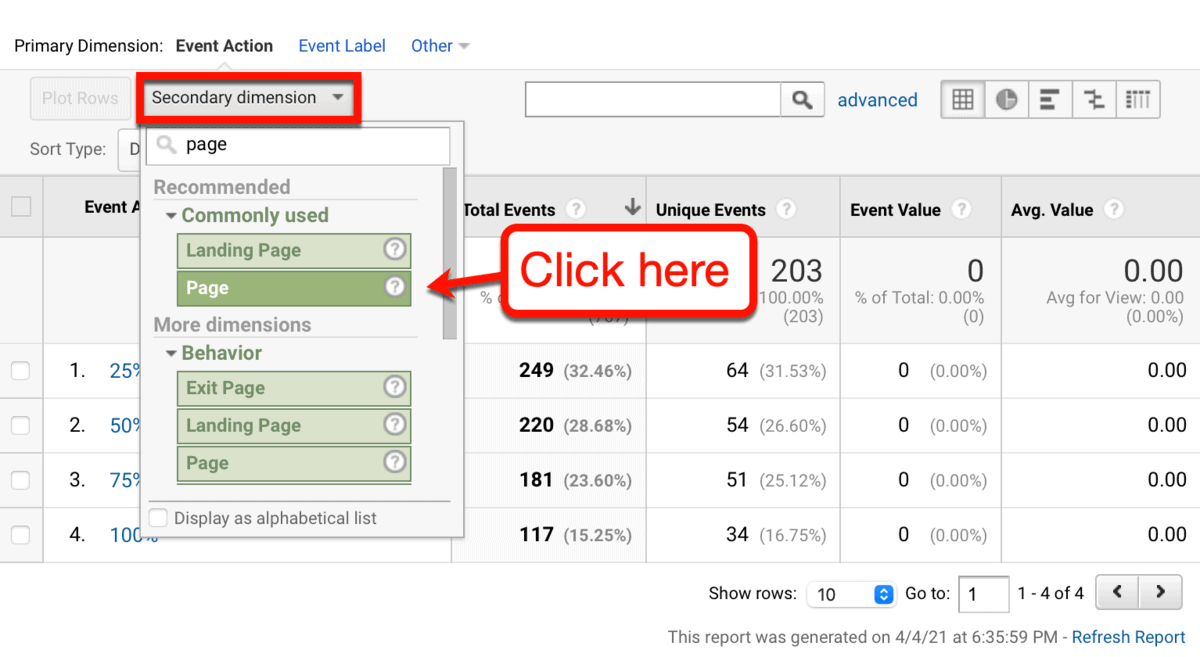
Google Analytics should immediately refresh the report with the specific pages that trigger scroll events.
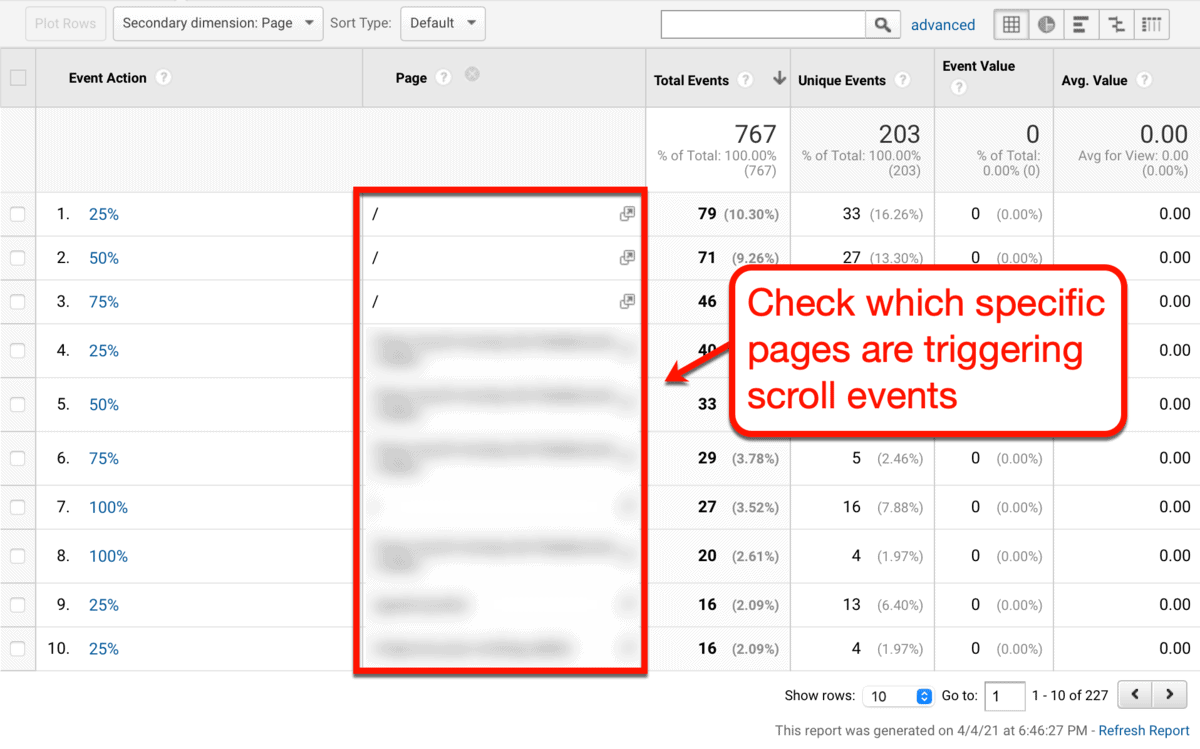
With this information, your next plans of action should be pretty straightforward.
To put you on the right track, here are some tips for pages with a lot of specific scroll events:
- 25% scroll events – Make sure you write a compelling introduction and build anticipation by highlighting what readers will get from your content. Adding a “Table of Contents” is a surefire way to get readers past the 25% scroll mark.
- 50% scroll events – Your content might be longer than necessary. Consider lowering the word count and focus on adding more actionable information.
- 75% scroll events – Your readers are ready to take action, but you’re taking too long to get to the point. Try deleting or shortening supplementary sections like FAQs, additional tips, and so on.
- 100% scroll events – You can use pages with a lot of 100% scroll events to help shape your content strategy. Try to replicate the strategies you’ve used like blog post structure, visual content styles, and internal links in future posts.
Measuring conversion rate
Alright – you now know how to measure almost all of the essential engagement metrics I mentioned above.
The next and last metric you need to measure is conversion rate, which is often considered the most important.
There are different ways to track conversion rates.
For example, if you’re using a lead generation platform like ConvertBox, you can utilize the built-in statistics tool for tracking. Simply click ‘Stats’ from your main account dashboard to see the data.

To view the statistics of specific forms, be sure to select the right group and “convertbox” using the drop-down menus.
Your conversion rate should appear as the “Lead conv” metric.
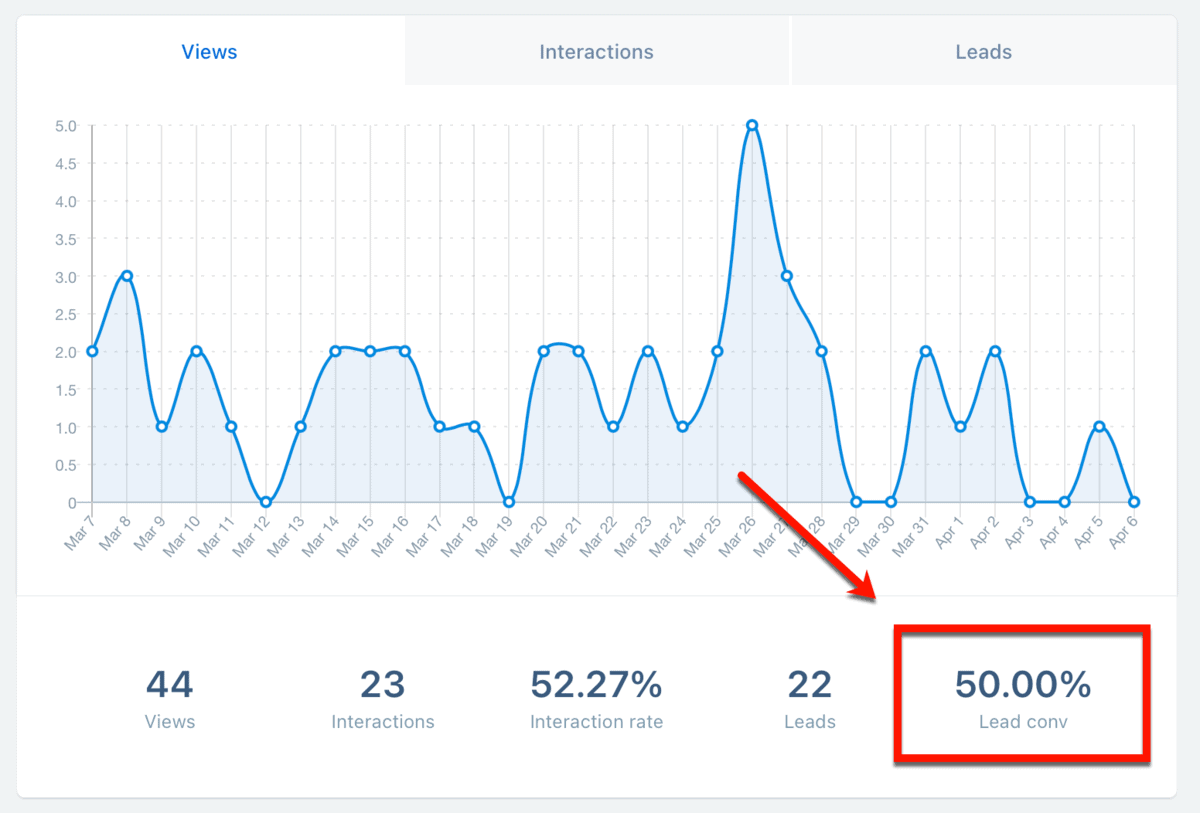
To learn more, you can read my full ConvertBox review and tutorial.
Of course, ConvertBox isn’t the only tool with a built-in analytics tool for tracking conversions.
Form builders, email marketing tools, eCommerce platforms – most of them should have conversion tracking baked in the software.
You can also set up goals on Google Analytics to consolidate your conversion tracking efforts.
To do this, head to the ‘Admin’ page of your Google Analytics account and click ‘Goals.’

This will take you to the list of goals you created for the specified Google Analytics property.
To create a goal, just click the red ‘New Goal’ button.

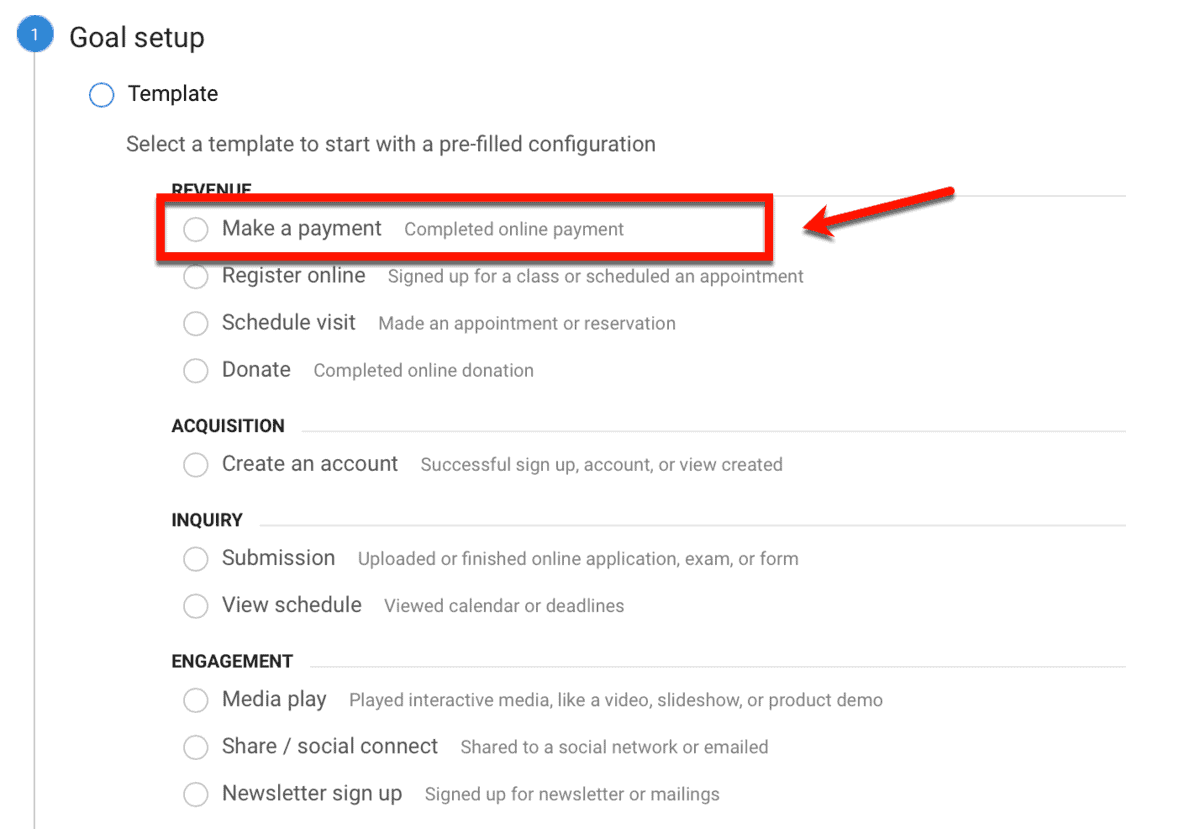
From there, you have the option to create a custom goal or use an existing template.
For beginners, picking a template is the way to so you understand how goals are configured.
Let’s say you want to track how many users make a purchase on your website. In which case, select ‘Make a payment’ and click ‘Continue.’
The next step is to set how the goal can be considered as completed. This can be done by choosing a “goal type,” which can be any of the following:
- Destination – Specify the page URL where users land after completing the goal.
- Duration – Set the minimum amount of time a user should spend on a specific page.
- Pages/Screens per session – Set how many pages a user should see.
- Event – Select a Google Analytics event associated with your desired goal.
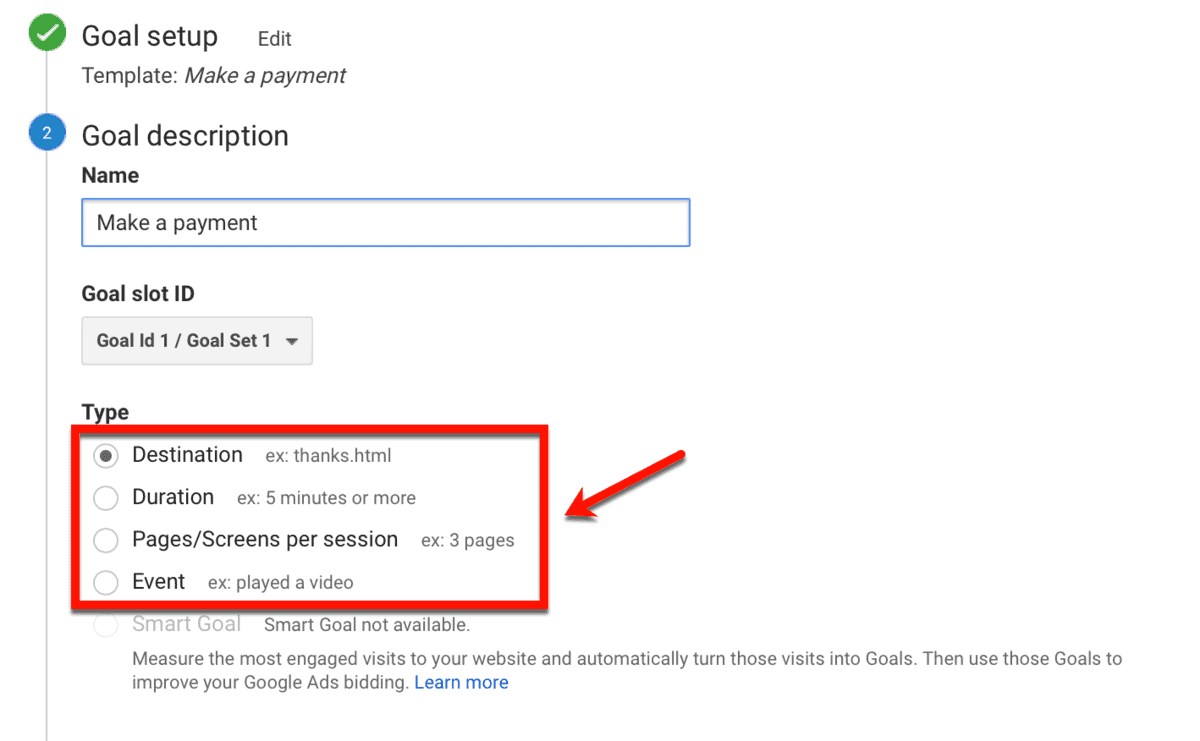
For the sake of this guide, let’s use the ‘Destination’ goal type.
What you need to do is enter the URL of the page users see after completing their payment. In most cases, this is the “thank you” page.

Already know how much you’ll make for this conversion?
You can easily assign a monetary value by clicking the ‘Value’ toggle and entering the price.
This is useful if you want to track your profits for fixed-price products or services.

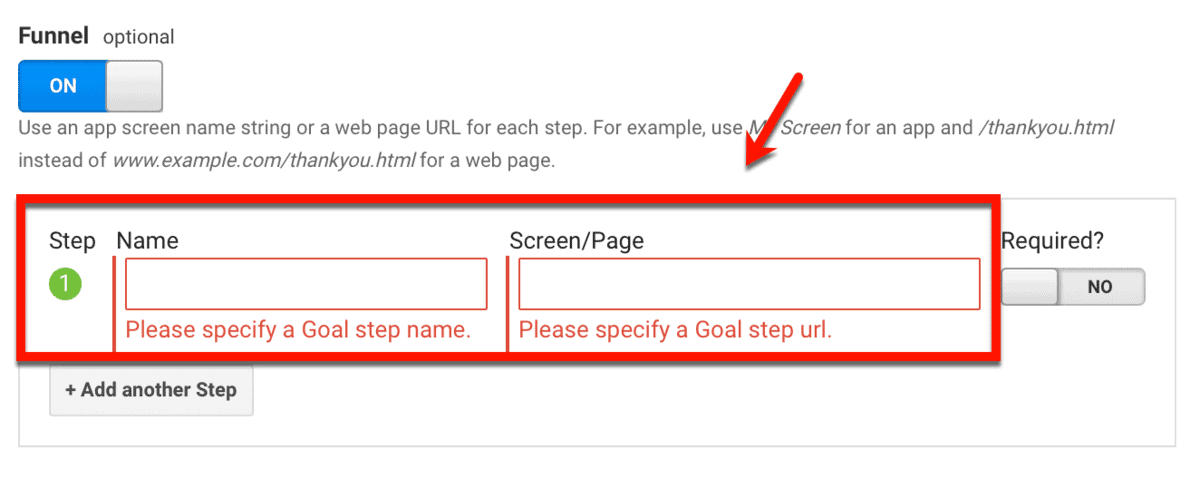
If you want, you can also specify other pages that users may have visited before arriving at the destination page. This may include a product page, pricing comparison article, review post, or any other page within your sales funnel.
You can do this by clicking the ‘Funnel’ toggle, entering a goal step name, and specifying the step page URL.
Before saving your goal, consider running a quick test by clicking ‘Verify this Goal.’
This will reveal how many times the goal is already completed based on existing data from the past seven days.
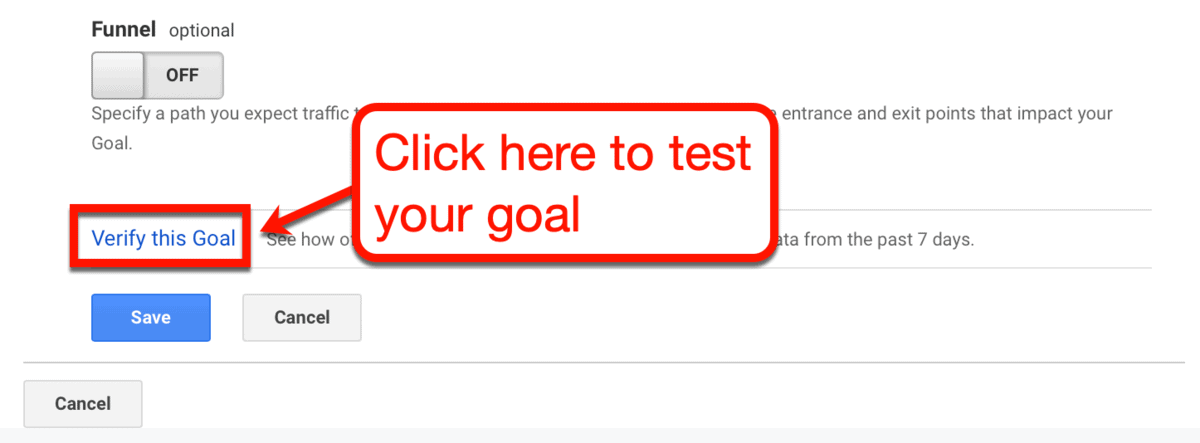
Upon clicking ‘Save,’ Google Analytics will start tracking the number of times your goal is completed.
You can monitor goal completions, along with the measured conversion rate, from the goals overview page. Just click ‘Conversions’ then select ‘Overview’ from the ‘Goals’ sub-menu.

I recommend watching the tutorial below by Benjamin Mangold of Loves Data. It covers the goal tracking features of Google Analytics in step-by-step detail.
Now, you could be asking:
“How on earth can I improve my conversion rates?”
Increasing your conversion rate actually requires you to work on improving all the engagement metrics listed above. More importantly, you need a clear understanding of blog conversion elements and how to make the most out of them.
Conclusion
Measuring engagement metrics is the first step towards improving user experience.
It allows you to make data-driven decisions when it comes to your website’s design, content, and overall marketing strategy.
After all, numbers don’t lie.
Just remember to check engagement metrics regularly, especially when trying something new.
While you’re at it, leave a comment below and tell me what you think about the post. Feel free to ask questions or share suggestions – I’ll be waiting!
You Might Also Like:
- 19 Ways to Reduce Bounce Rate on Your Blog and Maximize Your Traffic
- 11 Best Email Marketing Services for Bloggers
- Top 47 Blogging Tools to Make You a Smart Blogger
For More Go to : Master Blogging
No comments